A Tale of Four Neighborhoods: A Walkability Case Study in Milan
A Tale of Four Neighborhoods: A Walkability Case Study in Milan
Introduction: Why Walking Matters
In the complex tapestry of a modern city, the simple act of walking is a thread that connects us to our health, our environment, our community, and our economy. While we often think of cities in terms of skylines and transit systems, the true measure of a vibrant urban space is often found at the street level. This is the essence of "walkability," a concept defined as "how the built environment facilitates safe, comfortable, and easy walking access to everyday destinations."
A walkable neighborhood is more than just a place with sidewalks; it is an ecosystem designed for people. The benefits are profound and interconnected:
- Health: Walkable communities encourage physical activity, which helps lower the risk of chronic diseases and bolsters mental health.
- Environment: When people walk more and drive less, it reduces gas emissions and improves local air quality.
- Social: Streets that are pleasant to walk on promote community engagement, as neighbors are more likely to interact.
- Economic: Walkable neighborhoods are often associated with higher property values and can lead to lower public health costs.
This analysis explores walkability in practice by comparing four distinct neighborhoods (Nils) in Milan, Italy. By examining them through the lens of a detailed, data-driven study, we can answer a core question: What specific, measurable factors of the built environment make one neighborhood highly walkable, while another just a short distance away is not?
To compare these neighborhoods fairly, we must first understand the fundamental "building blocks" of walkability that the researchers used in their study.
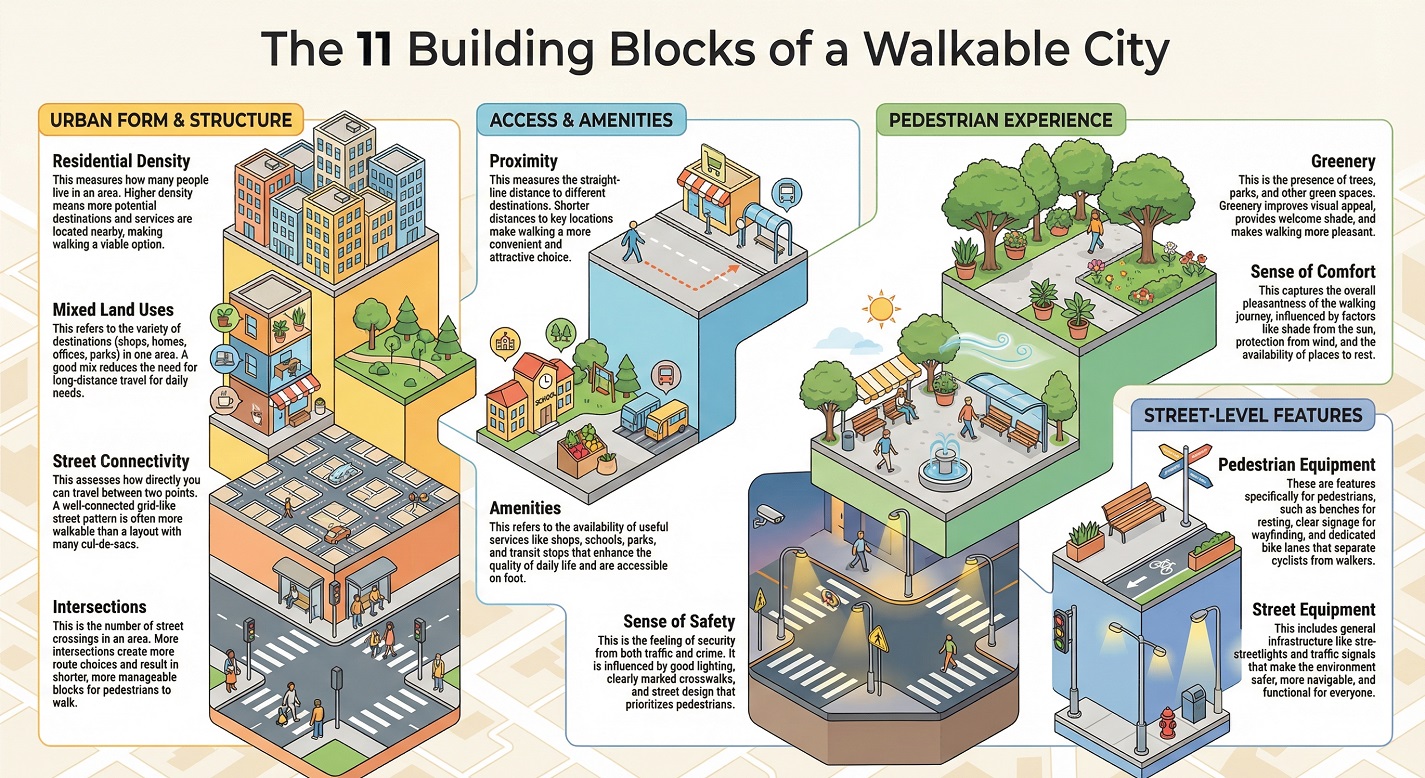
1. The 11 Building Blocks of a Walkable City
The Milan study measured walkability not as a single feeling, but as a composite score derived from eleven distinct variables. These variables capture everything from the physical layout of the streets to the quality of the pedestrian experience.
|
Category |
Variable |
What It Means for a Pedestrian |
|
Urban Form & Structure
|
Residential Density |
How many people live in an area. Higher density means more potential destinations and services nearby. |
|
Land Uses (Mixed) |
The variety of destinations (shops, homes, offices) in one area. A good mix reduces the need to travel far. |
|
|
Street Connectivity |
How directly you can travel between two points. A grid-like pattern is often more connected than cul-de-sacs. |
|
|
Intersections |
The number of street crossings. More intersections mean more route choices and shorter blocks to walk. |
|
|
Access & Amenities
|
Proximity |
The straight-line distance to different destinations. Shorter distances make walking more convenient. |
|
Amenities |
The availability of useful services like shops, schools, and parks that enhance the quality of daily life. |
|
|
Pedestrian Experience
|
Greenery |
The presence of trees, parks, and green spaces, which improves visual appeal and provides shade. |
|
Sense of Comfort |
The overall pleasantness of walking, influenced by factors like shade, temperature, and places to rest. |
|
|
Sense of Safety |
The feeling of security from traffic and crime, influenced by lighting, crosswalks, and street design. |
|
|
Street-Level Features
|
Pedestrian Equipment |
Features for pedestrians, such as benches for resting and dedicated bike lanes. |
|
Street Equipment |
Infrastructure like streetlights and signage that make the environment safer and easier to navigate. |
These eleven variables are our analytical toolkit. Now, let's use them to deconstruct the lived reality of four Milanese neighborhoods and see why their pedestrian experiences are worlds apart.
2. The Neighborhood Showdown: A Comparative Analysis
The study analyzed four neighborhoods—Nil 21, Nil 22, Nil 15, and Nil 71—and found significant differences in their walkability scores. The overall finding was clear:
Nil 21 exhibited the highest walkability score (0.65) based on compact form and accessibility, whereas Nil 15 and Nil 71 received the lowest scores because of a lack of greenery, infrastructure, and comfort.
2.1. The Champion: Nil 21 (Buenos Aires) — The Archetype of Density Done Right
Nil 21 emerged as the most walkable neighborhood in the study, serving as a model for successful urban design. Its success is built on a strong foundation of urban density and accessibility, making it an archetype of density done right.
- Primary Strength: High Density & Proximity. The data shows that Nil 21 scores exceptionally high in both Residential Density and Proximity. This indicates a compact urban area where a large number of homes are closely integrated with services, shops, and other destinations.
- The Result: This synergy creates a neighborhood where daily needs are easily met on foot, making walking the most logical and convenient mode of travel.
2.2. The Contender: Nil 22 (Città Studi) — The Model of a Balanced, Resident-Focused Experience
Nil 22 demonstrated a balanced and high level of walkability, showcasing a different path to creating a pedestrian-friendly environment. It excels not through sheer density but through the quality of the walking experience, making it a model of resident-focused design.
- Primary Strength: High-Quality Pedestrian Experience. Nil 22's standout scores are in Sense of Comfort and Street Equipment. This points to a deliberate strategy of investing in a high-quality, human-centered public realm with good lighting, public seating, and other features that make walking pleasant and safe.
- The Result: Unlike the other neighborhoods which show dramatic peaks and valleys, Nil 22's radar chart profile is more balanced, suggesting a consistently well-managed urban environment that supports walkability through thoughtful design.
2.3. The Underperformers: Nil 15 (Bicocca) & Nil 71 (Villapizzone)
These two neighborhoods serve as powerful case studies in low walkability, scoring significantly below the average and highlighting critical failures in planning and design.
Nil 15 (Bicocca): A Cautionary Tale of Systemic Failure
This neighborhood consistently recorded the lowest values across most indicators, making it a cautionary tale of systemic failure. Its most critical weaknesses are extremely low scores for Sense of Safety and Intersection Density. This combination points to an environment with long, uninterrupted blocks and poor traffic management, making the neighborhood feel both unsafe and inconvenient for anyone on foot.
Nil 71 (Villapizzone): The Paradox of Wasted Potential
Nil 71 presents a paradox of wasted potential. It possesses some of the raw ingredients for good walkability, but fails to deliver a quality experience. The data shows it scores relatively high in Connectivity and Greenery but poorly in Sense of Comfort and Intersection Density. This paradox suggests a neighborhood with a good underlying street layout, but the experience of walking is so poor that it negates the potential benefits of its form.
Nil 15's failure is one of fundamentals; it lacks the basic ingredients of safety and connectivity. Nil 71's failure is more nuanced and perhaps more tragic: it possesses a good structural foundation but fails in its execution, delivering a poor human experience that negates its potential.
These neighborhood profiles reveal distinct outcomes, but they don't yet explain the cause. To move from observation to diagnosis, we must turn to the study's correlation analysis, which uncovers the hidden relationships driving these results.
3. Connecting the Dots: What the Data Reveals About Walkability
The study's correlation analysis helps us understand why certain variables are so important by revealing how they influence one another. This moves us from simply measuring walkability to understanding its DNA. When we dig into the data, three critical insights stand out.
3.1. Insight 1: Greenery and Comfort are Deeply Connected
The most powerful relationship we find is the very strong positive correlation between Greenery and Sense of Comfort (r = 0.81).
- So what? This powerful link shows that adding green elements like street trees and parks is one of the most effective ways to directly improve the quality of the pedestrian experience. Greenery provides shade, aesthetic beauty, and a more pleasant atmosphere, making walking more comfortable and appealing.
3.2. Insight 2: Density Creates a "Walkability Flywheel."
The data reveals a cluster of strong positive correlations between Proximity, Amenities, and Residential Density.
- So what? This demonstrates a self-reinforcing cycle. The data shows a strong positive correlation between Amenities and Residential Density (r = 0.73) and between Proximity and Amenities (r = 0.76). In plain terms, higher density supports more services, and more services mean more destinations are close by. This creates a "walkability flywheel" where each element strengthens the others, making the entire neighborhood inherently more walkable.
3.3. Insight 3: Safety Isn't an Accident
The data reveals a critical insight: there is a significant correlation between a pedestrian's Sense of Safety and the presence of Street Equipment (r = 0.63).
- So what? This proves that a pedestrian's feeling of safety is directly tied to tangible infrastructure. Good street lighting, well-marked crosswalks, and clear signage are not just nice-to-haves; they are critical components for creating an environment where people feel secure enough to walk.
These insights provide a clear roadmap for what aspiring urban planners should focus on to make a real impact.
4. Key Takeaways for Future Urban Planners
The Milan case study offers several actionable lessons for anyone interested in building better cities. By distilling the analysis, we can arrive at three core principles.
Lesson 1: Form and Function Must Work Together.
A well-connected street network (good form) is not enough if the pedestrian experience (function) is poor. Nil 71 had a decent street layout but failed on comfort, making it unwalkable. In contrast, Nil 21 succeeded because its dense form was supported by excellent function—easy access to amenities. True walkability requires both a logical layout and a high-quality, safe, and comfortable experience.
Lesson 2: Focus on High-Impact Interventions.
The correlation analysis shows that certain interventions have multiplier effects. For instance, planting street trees is a high-impact intervention because it directly boosts Greenery, which is powerfully correlated with Sense of Comfort (r = 0.81). Simultaneously, an investment in Street Equipment doesn't just improve one metric; it has a strong positive effect on Sense of Safety (r = 0.63), a key driver of pedestrian behavior.
Lesson 3: Data-Driven Analysis Pinpoints Weaknesses.
A comprehensive walkability index is a powerful diagnostic tool that moves the conversation from vague complaints to specific, data-backed problems. Nil 15 is the prime example: the data didn't just say it was "bad for walking"; it clearly identified that "Sense of Safety" and "Intersection Density" were the critical areas that required targeted policy intervention. This allows planners to use limited resources for maximum impact.
5. Conclusion
The story of these four Milan neighborhoods shows that walkability is not a matter of chance, but a direct result of intentional design choices. Nil 21's success was rooted in its compact, mixed-use form that put daily needs within easy reach. In stark contrast, Nil 15 and Nil 71 failed, not because of one single flaw, but due to a combination of poor pedestrian infrastructure, a lack of safety, and a disconnected experience.
The central finding of this study is that walkability is not a single metric but a complex, multi-dimensional quality. It is the sum of a neighborhood's structure, its amenities, and the lived experience of walking its streets. This data-driven approach moves urban planning from guesswork to diagnosis, empowering us to build more equitable, healthy, and resilient cities not by chance, but by design.